Tapsonic: Codesign line chart reader for people with visual impairment
Tapsonic is a codesign workshop we run at UCL HereEast campus to design possible solutions for visualizing complexing line graphs for visually impaired users. An auditory-tactile was built in advance and under-tested for improvements and other insights. By the end of the session, the group explored stunning findings and future applications.
_________________________________________________________________________________________________________________
Team member: Delaney Warren, Hongbo Yan, Katherine Wang, Qian Zhang, Su yeon Oh, Zeyuan Zhang
UCL, HereEast
Mar, 2020

Background —
Previous studies have provided evidence that tactile feedback is beneficial in constructing graphical information to visually impaired people. Diverse research work has been implemented in areas including tactile printer, electro vibration touch screen and pin-array displays. However, there is insufficient research work in assisting blind people to obtain statistical graphic information. For example, line graphics composing of several data categories interweaving with each other.
In this codesign workshop, we proposed a coat-effective approach to assist visually impaired people to interpret the graphic-statistical information. We explored its adaptability and examied its functionaility under graphic reading scenarios.
_________________________________________________________
#Complicated graphical information interpretation
#Cost effective #Adoptability #Visual impairments

Current graphical interpreation solution does not support complicated line graoh interpretation
Video —

Video credits to Su yeon Oh
Solution —
Inspired by previous research work that focused on potential applications for rendering digital graphs for vision loss group. For instance, thermal tactile printer (See picture 1 and 2 on the right), which heats the thermal sensitive capsule to form haptic patterns that creates braille feeling. Other applications including electrovibration touch screen (Bau et al) that generates distinctive tactile touch feedbacks by changing the electric current passing through fingertips (See picture 3 and 4 on the right).


REPLACE THIS IMAGE LATER
To generate ideas, we run brainstorm sessions for rapid idea diverging. After considering the technological feasibility, we decided to use the haptic and sonic feedback for graphical information reading. From which the different colour, data category could be identified by the colour sensor which is widely adopted in the assistive technology industry.
Prototype —
Responding to the previous quesitons, we proposed a low cost prototype system based on Arduino. The initial prototype consists of a gantry system, vibration motor, colour sensor, Arduino and speakers.
To read the graph, users can slide the block on the 2-axis gantry system for tracing the line graph, different categories of data will trigger distinctive audio feedback as the substitute of colour and vibration feedback is provided when users failed to follow the line. By this approach, we were inquisitive about how blind people interpret graphical information, especially in complicated situations where different lines constantly intersect with each other.
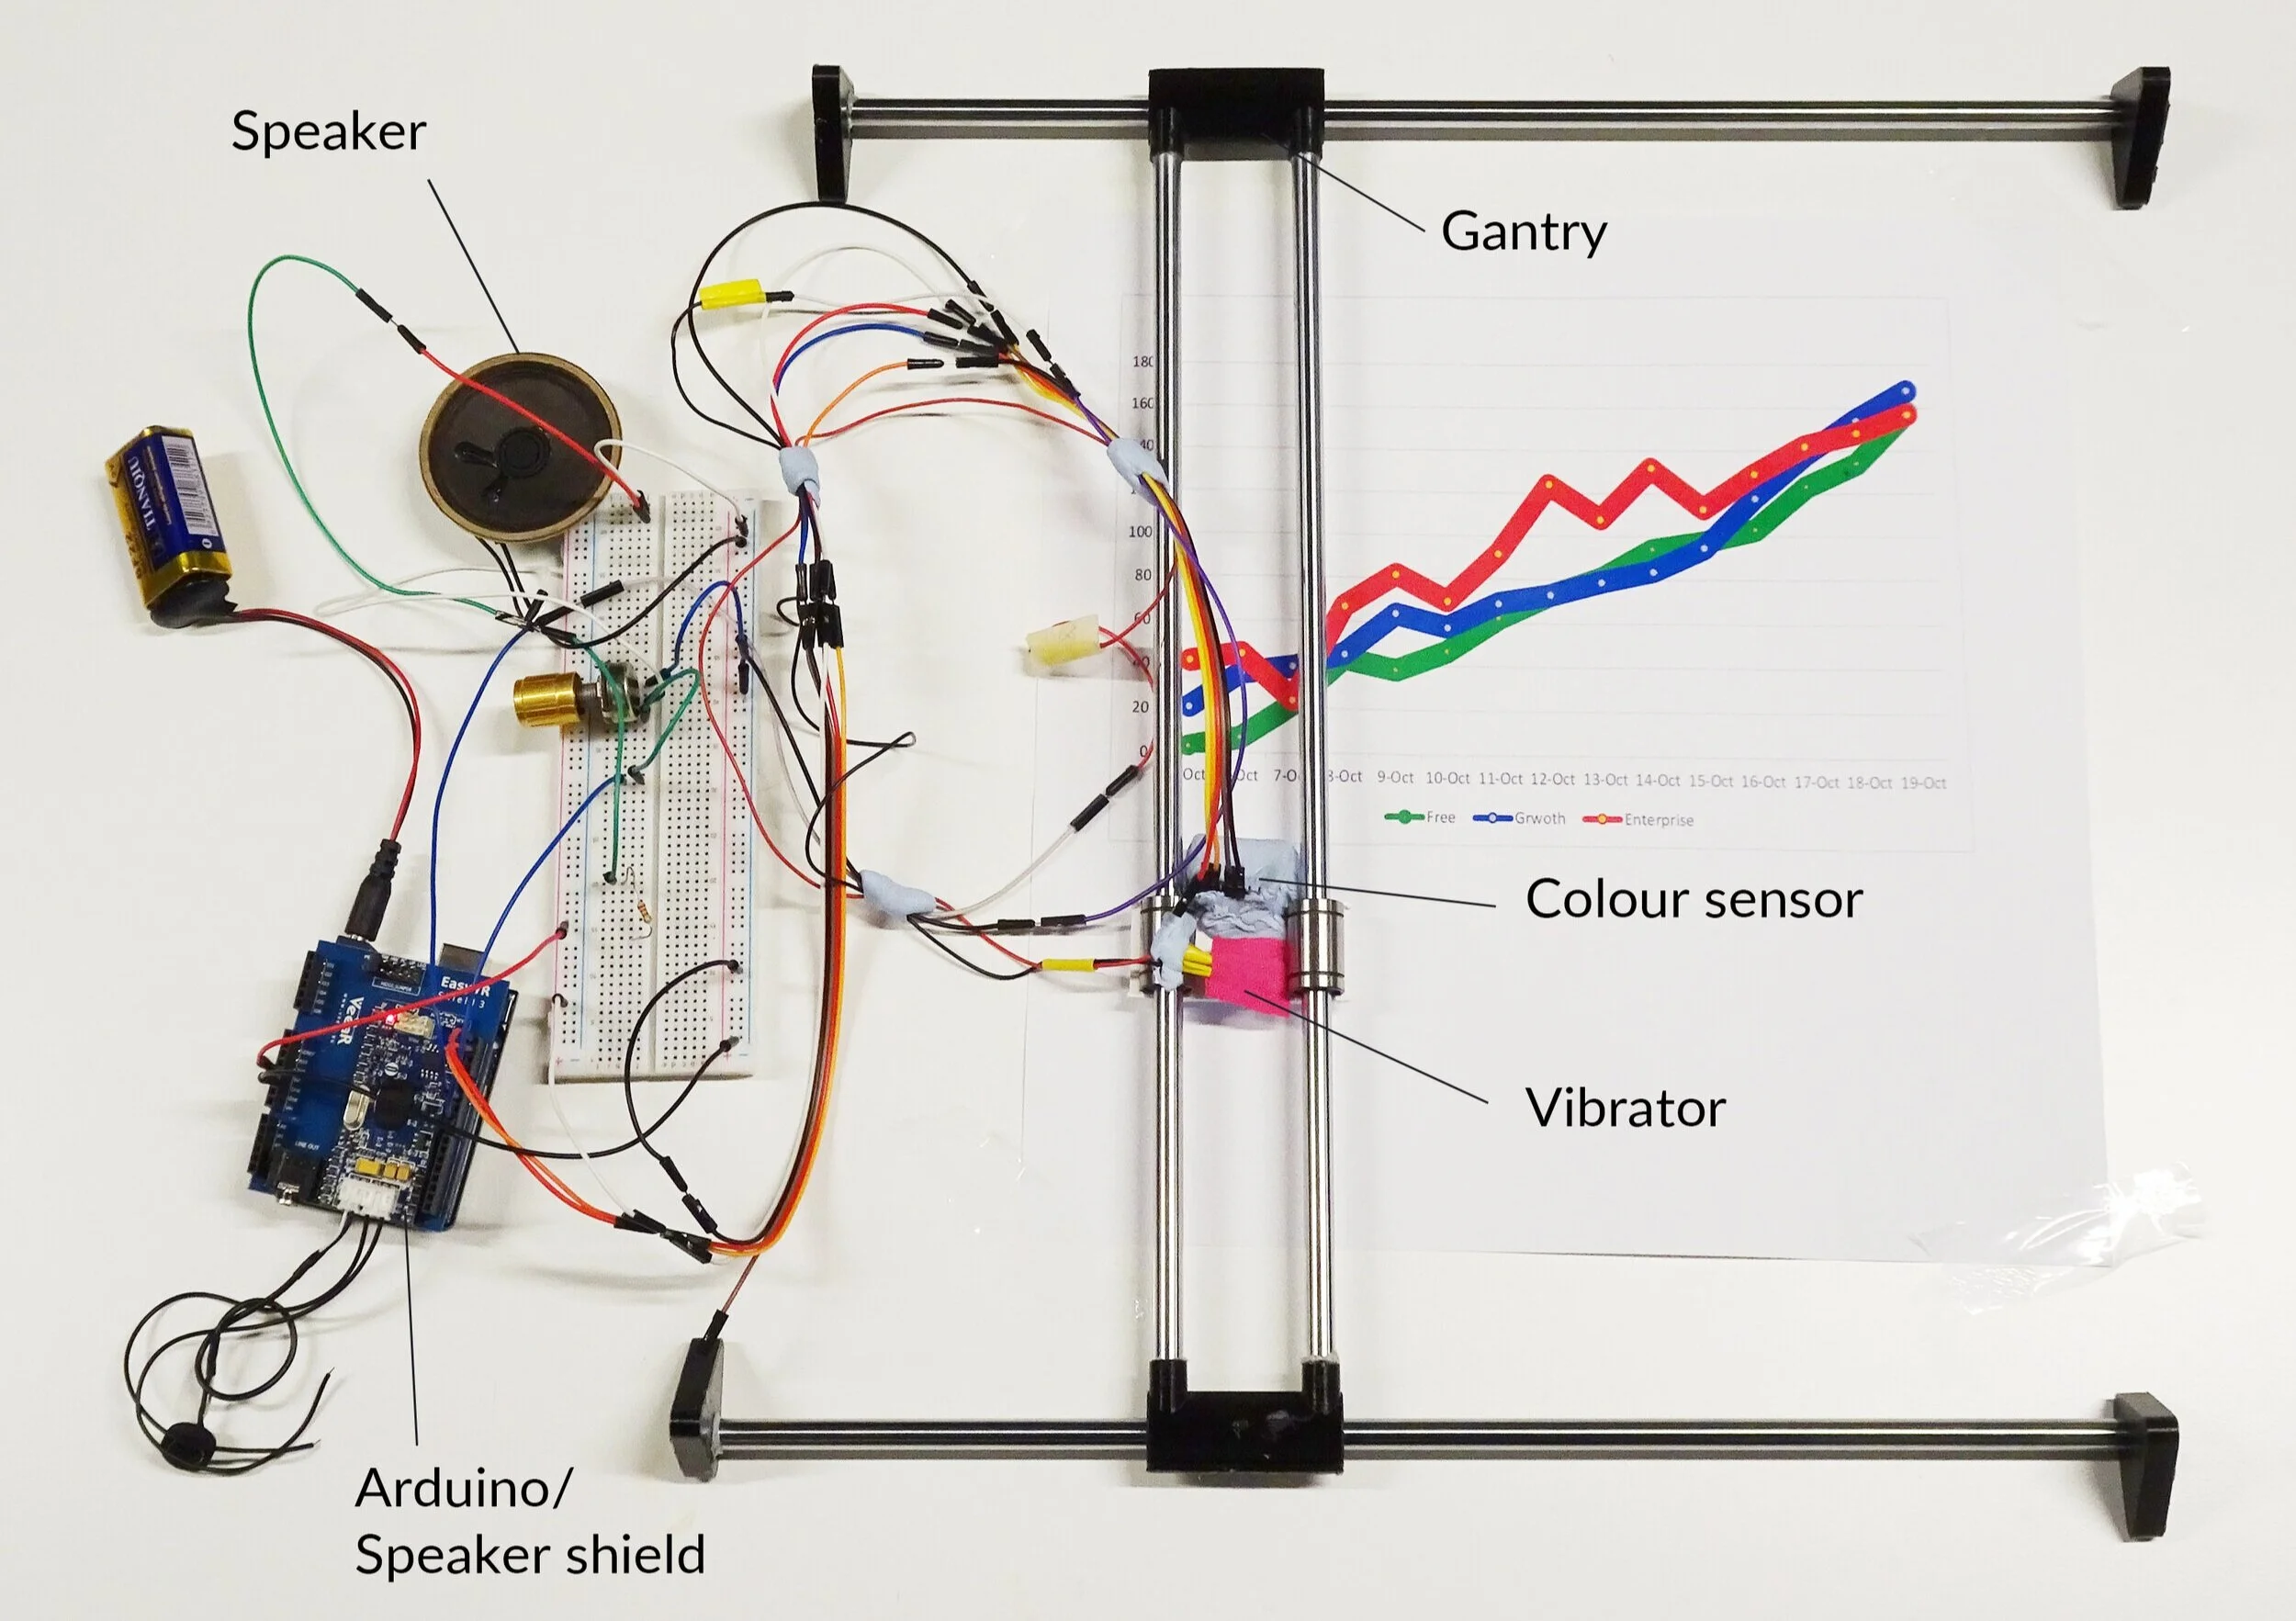

The working principle of the initial prototype:
Green-> tune D2
Blue -> tune E5 >
Green -> tune G2 >
No colour -> vibration
Codesign —
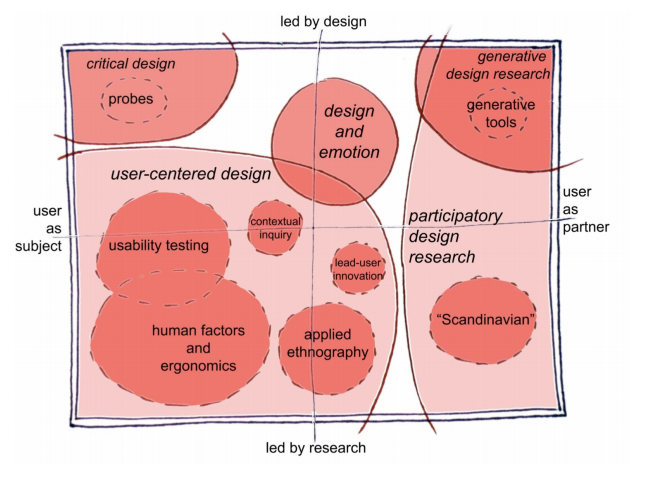
Our group run half-day co-design session together with the visually impaired people at UCL HereEast to together identify the tactile graphic design challenge. From such an approach, we were supposed to include a user-centred design principle and participatory design research in a holistic cycle and obtained meaningful inspirations for later design work.

How was the session arranged —
The session was devived into mainly six stages, from which our group started with a short discussion and task allocation for preparation. After that, we conducted a pilot test to identify the possible missing points and unfathomable sessions from the perspective of visual disabilities. Then we welcomed three visually impaired folk to have a first-hand experience of our initial prototype. We performed followed up an interview to examine the extent that the graph was interpreted and verbalized the interview script for further analyzation.
Participant test —
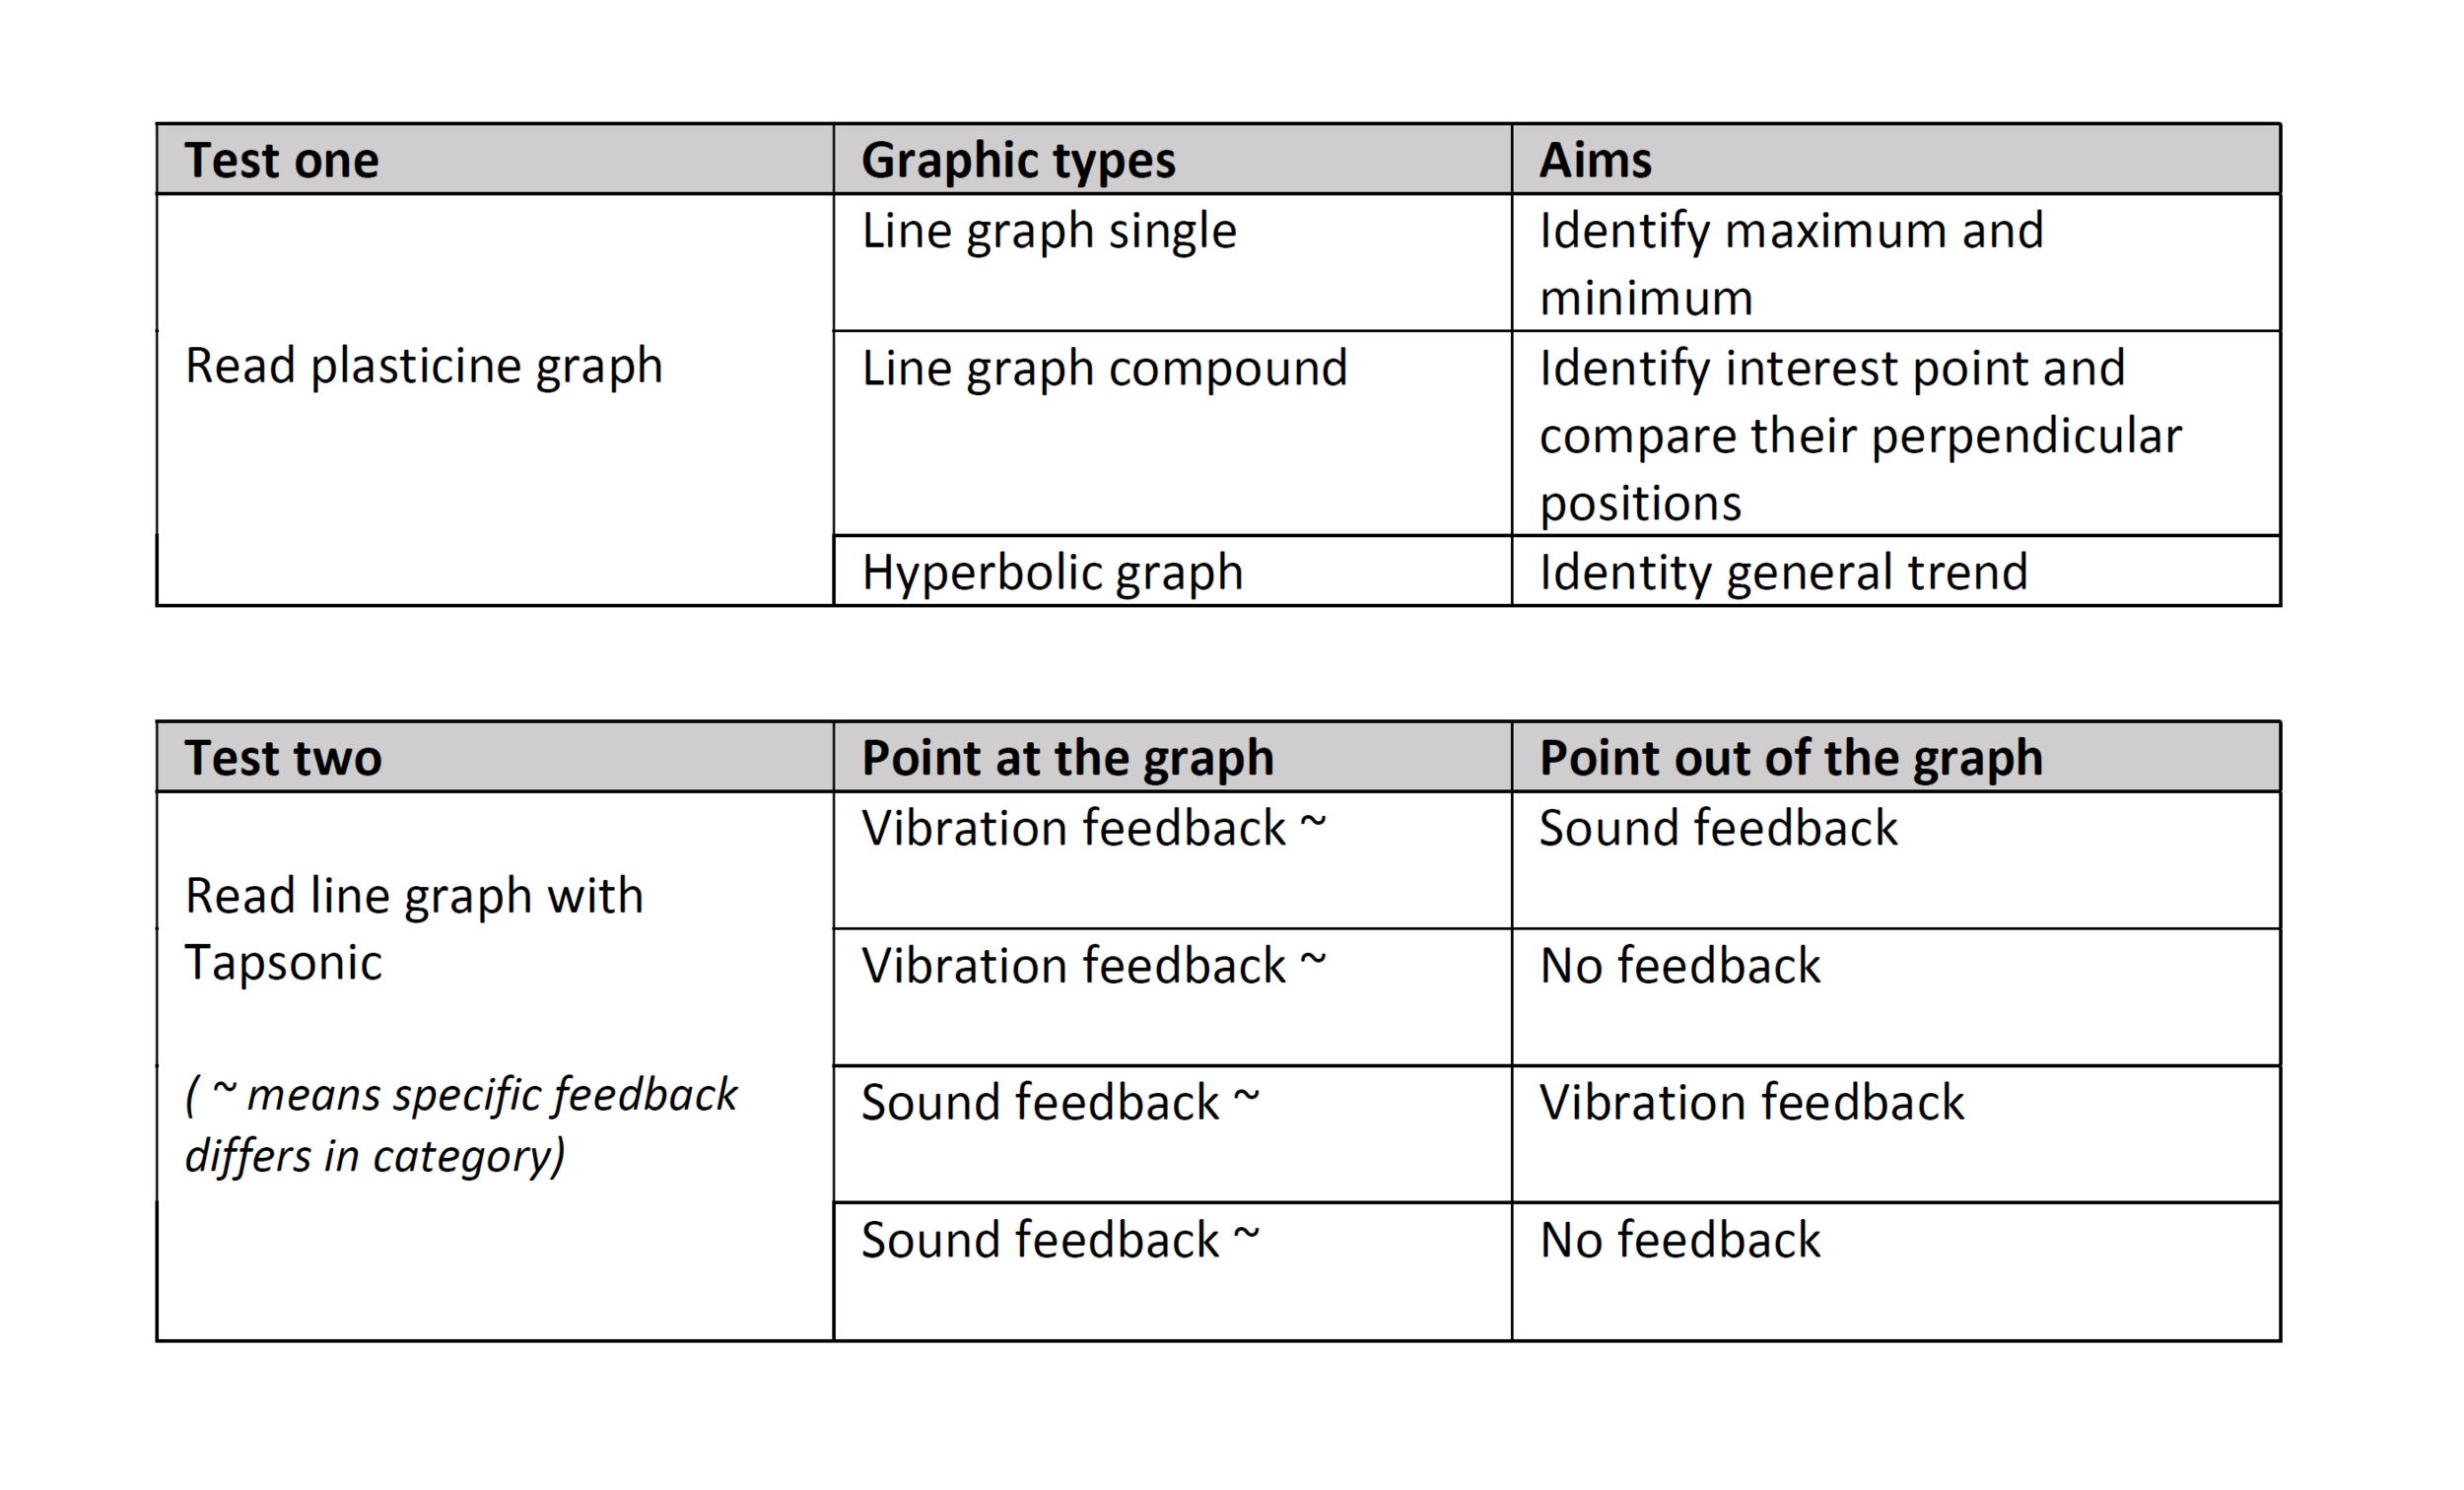
During the test session, our group was eager to explore which feedback was more intriggering for visual impaired people, haptic, sonic only or in a combination it works well. We devideed the session into two sub test, from the first users were supposed to read the information presented by plasticine. Different data catageory was represented by different height of the layer, from which we would like to construct a basic understanding of how blind people understand the graphics in a more direct approach.
After the first experiment, we invited participants to examine our initial prototype by sonic and tapic oriented appoach seperately. They were then informed to use the device to find the intersect points of the graph and the results were compared for analysis.

First experiment with plasticine graph

Second experienment with Tapsonic

Test in progress
Results —
For test one result —
Negative:
#1 It was not easy for blind people to distinguish the graph in a holistic perspective, the perception mechanism supports intermittent line segment, however, when combing separate lines into one continuous graph, it caused cognitive burden and may significantly influence the final cognition.
#2 The plasticine material was not firmly attached to paper and when moving fingertips around the lines it may accidentally cause placement of the position which interference their geographical perception.
Suggestion:
#1 Have a verbal description of the graph.
#2 Create reference border for value comparison.
__________________________________________
For test two result —
Negative:
#1 When moving the sliding blocks constantly in the plane, it is not practical for people to memory the spatial location accurately in short term memory. And this phenomenon is also represented when they were asked to reproduce the general trend of the graph. Such findings inspire our group to conduct more background research on how visually impaired group visualize the spatial location information.
Positive and suggestion:
#1 The design is beneficial for them to build a primary understanding of the graph when haptic and sonic feedback is provided at the same time. Specifically, they mentioned that the auditory feedback could be more accurate to reflect the real value of the data rather than simply changing the volume or tune. While for the haptic feedback, it could be adopted to support the recognition of the changing points of the graph.
Discussion —
The test findings that precious technology focuses on interpreting and explaining graphics information in a more implicit way, such as the patterns rather than finding details on the graphics. And when it comes to accurate graphical readings, solely relied on tactile feedback may not able to achieve the desired results. Supporting tactile reading by explicit verbal explanation could be a solution for the visually impaired group.
The workshop illustrated that the constrains of the perception system for blind people when reading tactile graphics and further challenges the feasibility of the prototype in supporting interpreting the information. By acquiring those insightful findings, we were eager to move the next step and for a more feasible solution.
Acknowledgement
We would like to express our sincere gratitude to the participants who joined the co-design sessions, with their generous advice, it inspired us for a next iteration of the design work and we were more understanding of the difficulties that visually impaired people were struggling within routine life. And we would like to express gratitude to Albert Higgins who was always our solid support.